Visual warehouse interface using SVG
After a roadtrip visiting a few of our DataFlex developer customers it turns out that many of them build systems that interact with some kind of warehouse. One of the companies we (FrontIoT) visited already had a visual overview over the warehouse in their Windows solution, for a better overview of what was going to be picked, and another had a sorting function calculating the shortest path for picking an order in a warehouse. Since we work mostly in web these days, we were asked about the posibillity to do something similar for their web solution. This is my first draft I through together over how it could work.
You can check out the result and look at the code here. All code is in the same file. So, you can just right click and save as and the open the html-file in a text editor.
What technology to use
There are a couple of ways you could do this, by regenerate image files that are displayed on the browser or just use regular html and css to style some div elements. You also got the option of drawing on a canvas element. But to build the most flexible and extecible solution for this I wanted to do it as an SVG. The other reason for picking SVG is that I wanted some more experiene playing around with it.
The solution step by step
I'm a bit of a brute force when it comes to new things, so I basically took an SVG icon, copied the code and started deleting and editing stuff to see what happend. As I write this post on the other hand, I want you to get the best practices and the right facts, so that I do not misslead you to far away. So I do recomend you spend some time checking out some resource on how to create svgs, before you get to deep.
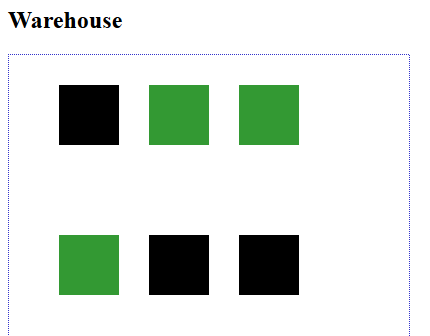
1. The SVG
The SVG is fairly simple. It contains a viewBox that describes where the frame should look at and some path elements that represent the locations in the warehouse for this sample. Each path has an id, that we will use later to pick the location with javascript and some coordinates that displays the corners of the location. I realize that had I used lowecase l instead of uppercase L I would have needed to write less coordinates, since the lower case are regarded as relative to the previous point. But I'll have to fix that for the live version.
2. The Order list
To represent the order list, I just created a simple html list using divs that I later styled with some css to have them look ok. The important piece for the project is the class="order" and the data-loc="0" attributes on the order lines, since we are going to use them in the javascript later.
Order list


		Order 1

			Potato
			Carrot
			Pepper fruit


	...
3. The JavaScript
To put this all together, all we have to do now is to write a small JavaScript that collects the list of orders and add a click trigger to them. When they are clicked the script pick all the lines within the clicked order this and reads the data-loc. Using the location id, we find the corresponding SVG path and change the fill color of that element.
Hope you enjoyed this small sample; the goal is to use this to do some more interesting stuff in the future. I expect that I will build a DataFlex plugin at some point and we are also looking to create a product for warehouses using machine learning that perhaps could benefit from this interface as a way of representing the data. So, do not forget to drop buy from time to time and if you want to get updates when I post, do not forget to register to my newsletter
- warehouse, interface, pick, design